|
Cacti : Add Monitoring Host
2016/06/08 |
|
Add Monitoring Target Host on the network.
|
|
| [1] | Install SNMP on the target host you'd like to monitor. |
|
root@node01:~#
apt-get -y install snmp snmpd snmp-mibs-downloader
root@node01:~#
vi /etc/snmp/snmp.conf # line 4: comment out # mibs :
root@node01:~#
vi /etc/snmp/snmpd.conf # line 15: comment out # agentAddress udp:127.0.0.1:161
# line 17: uncomment agentAddress udp:161,udp6:[::1]:161 # line 49: uncomment and change to any comunity name you like rocommunity Serverworld localhost
# line 51: comment out # rocommunity public default -V systemonly
# line 59: uncomment and change to any comunity name & change access permission rocommunity Serverworld 10.0.0.0/24
root@node01:~#
systemctl restart snmpd
# validation (replace "Serverworld" to the comunity name you set) root@node01:~# snmpwalk -v 2c -c Serverworld localhost system
SNMPv2-MIB::sysDescr.0 = STRING: Linux node01.srv.world 4.4.0-22-generic
    #40-Ubuntu SMP Thu May 12 22:03:46 UTC 2016 x86_64
SNMPv2-MIB::sysObjectID.0 = OID: NET-SNMP-MIB::netSnmpAgentOIDs.10
DISMAN-EVENT-MIB::sysUpTimeInstance = Timeticks: (2213) 0:00:22.13
.....
.....
SNMPv2-MIB::sysORUpTime.9 = Timeticks: (1) 0:00:00.01
SNMPv2-MIB::sysORUpTime.10 = Timeticks: (1) 0:00:00.01
|
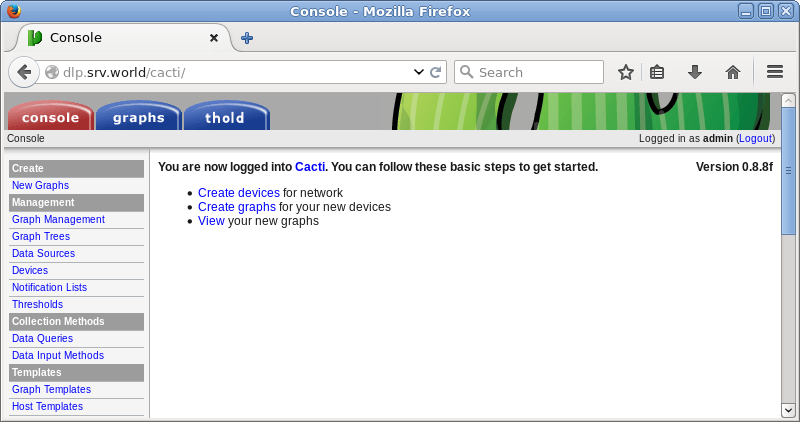
| [2] | Login to Cacti admin site and click "Devices" on the left menu. |
|
|
| [3] | Click "Add" in the right pane. |
|
|
| [4] | Input items like follows and click "Create" button. Description ⇒ simply description Hostname ⇒ target's hostname or IP address Host Template ⇒ ucd/net SNMP Host SNMP Comunity ⇒ the comunity name you set in [1] |
|
|
| [5] | After saving settings, click "Graph Trees" on the left menu and click "Default Tree" in the right pane. |
|
|
| [6] | Click "Add" in the right pane. |
|
|
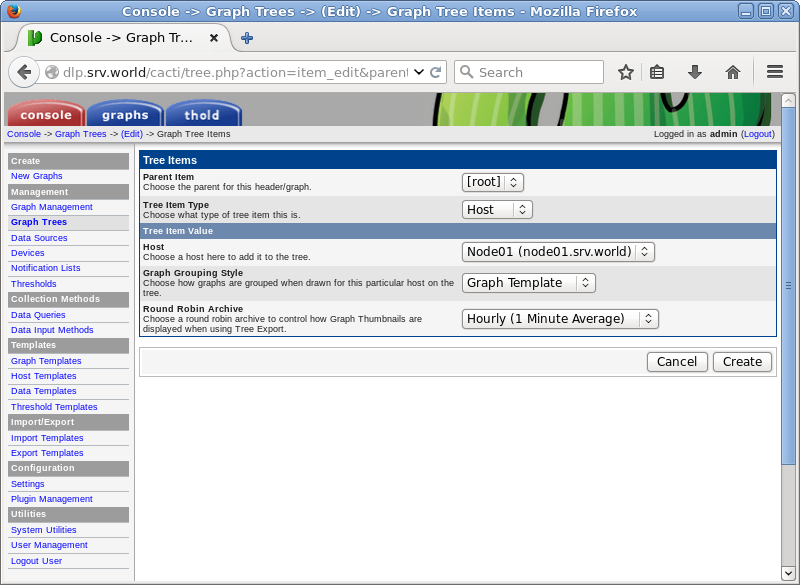
| [7] | Select "Host" in "Tree Item Type" field and select target Host in "Host" field and then click "Create" button. |
|
|
| [8] | Click "Save" button. |
|
|
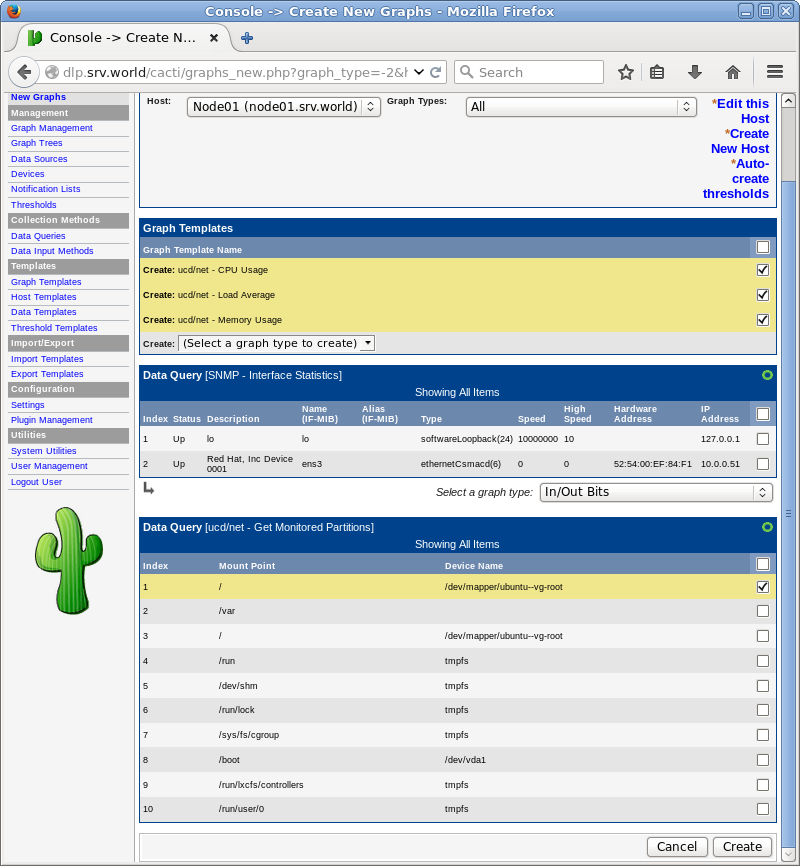
| [9] | Click "New Graphs" on the left menu and select graphs you'd like to add in the right pane and then click "Create" button. |
|
|
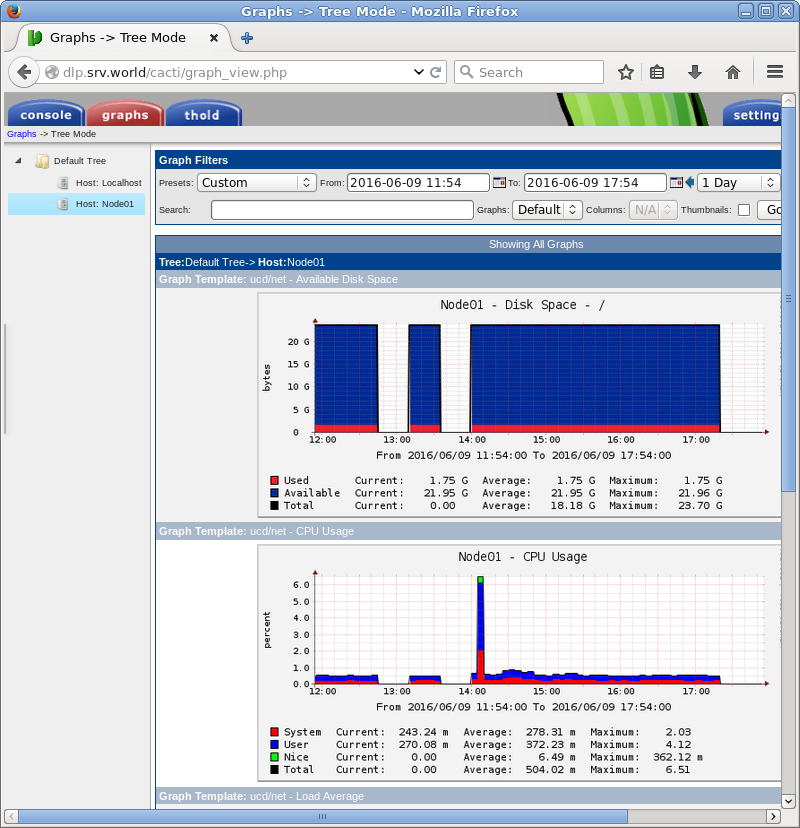
| [10] | After few minutes later, move to the "graphs" tab to view the system status to select the new target host on the left menu like follows. |
|
|


